
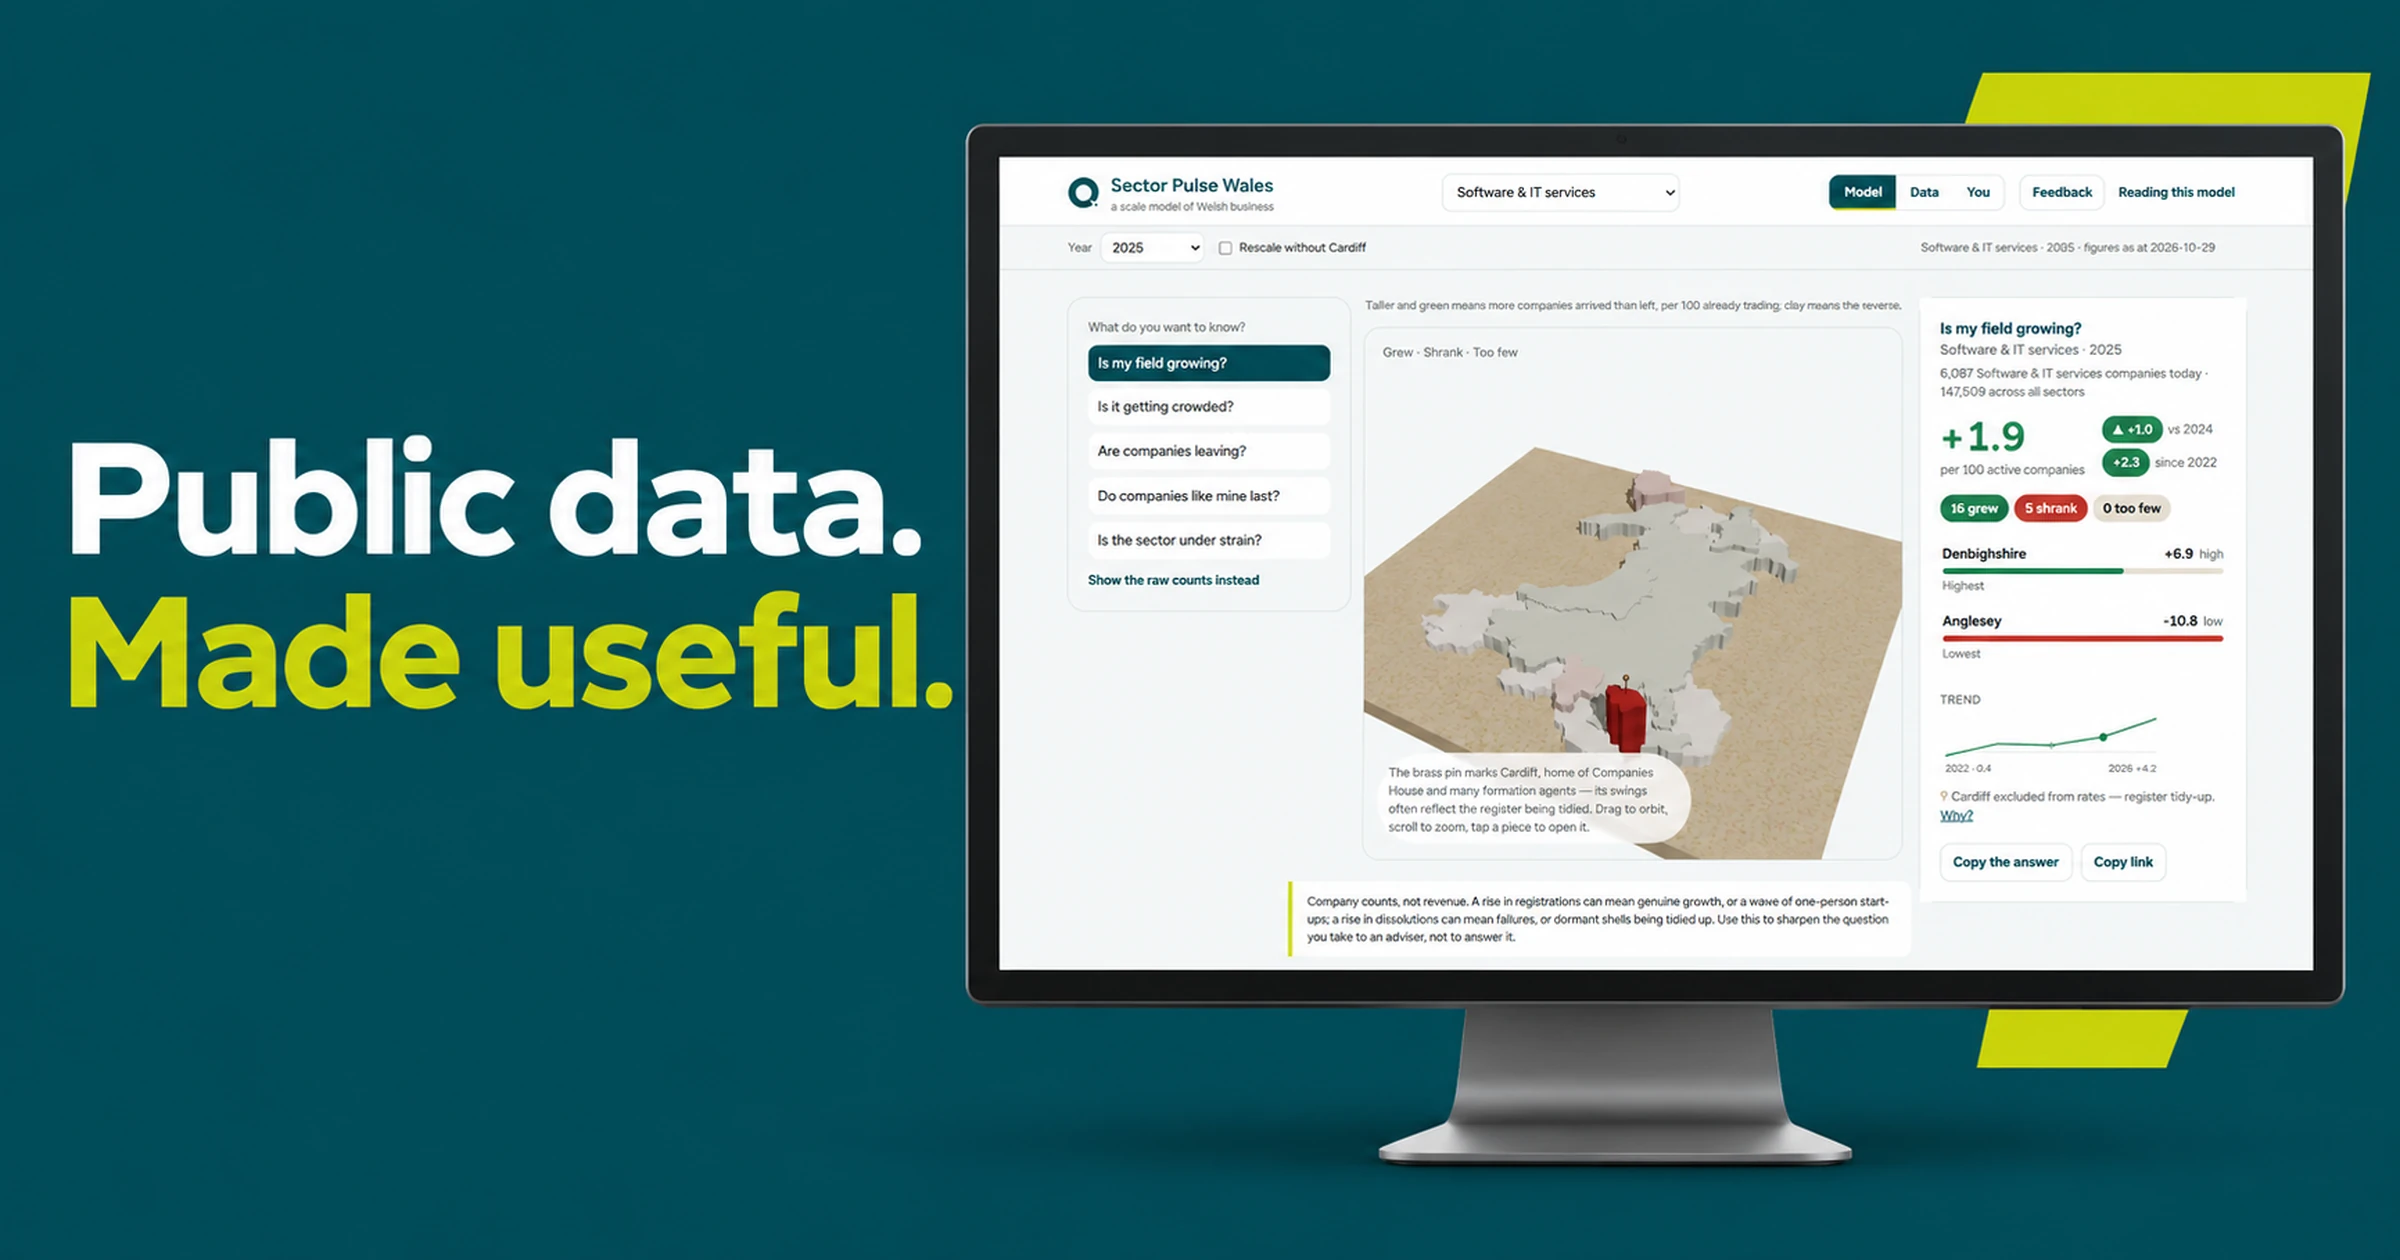
In September, we built Sector Pulse Wales, a free tool designed for Business Wales advisers and their clients. It brings company-register information and official business statistics into an interactive view of Wales, where someone can explore their sector, compare areas and put their own business in context.1
The build took shape through repeated revisions over 3–4 September, supported by research and analysis of the underlying sources. Faster development gave us something tangible to test early, and room to refine how the tool worked.
The opportunity was to make existing information easier to use, and to show how more people can build tools around the questions that matter to them. Much of the data was already available. Our job was to decide which questions the tool should help someone answer, and how to present the information without losing its meaning.
From a published dataset to a business question
Sector Pulse Wales began with a request for something useful to Business Wales’s Accelerated Growth Programme clients. We built an interface around questions a business owner might bring to an adviser.
Early versions led with measures such as entry rates, exit rates and net change. We changed those controls to questions: “Is my field growing?”, “Is it getting crowded?” and “Do companies like mine last?”
That gives someone a way into the information without first having to understand the dataset.
Choose a sector and year, explore the model of Wales, then select an area for more detail. An answer card sits beside the map so the reader can see what the chosen measure represents.1
The question is a starting point for exploration. It is also a design responsibility: the information shown must support the question being asked.
Different views for different tasks
The tool has three views: Model, Data and You.1
The Model view helps someone explore geographical differences. The Data view puts the figures into a table for closer comparison. The You view uses details about a business to show relevant context, with sources and method alongside the results.
We wanted readers to move between an overview and the detail behind it. Someone might notice an area on the map, inspect its figures, then look at the comparison table to understand how it relates to other places.
The visual has a purpose in that sequence. It helps someone find their way into the information, while the table gives them another way to inspect it.
What Cardiff taught us about the interface
During the September build, one result stood out. For Software and IT services in 2025, our register-based calculation showed a net decline of 2,838 companies in Cardiff.
That was a reason to investigate. It could not, by itself, tell us how many operating software businesses the city had lost.
Registered-office locations and trading locations are different things. The Office for National Statistics explains that multiple registrations at a single postcode, including those associated with formation agents and virtual offices, can distort local business figures.2
The interface needed to make that limitation visible. We added explanatory notes and a control to rescale the map without Cardiff dominating its height. Cardiff remained visible, with the reason for the treatment explained.
We also kept register counts and official statistics alongside one another, rather than treating them as interchangeable. Where there were too few registrations for the tool’s chosen threshold, the design showed counts and withheld rates.
These decisions affected what someone would take away from the screen. A finished-looking map could otherwise encourage a conclusion the data did not support.
The work behind a useful interface
We used Lovable to build and refine the front end, and Three.js, an open-source JavaScript library, for the interactive 3D model of Wales.3 Those tools were part of a wider process involving source research, analysis and repeated design decisions.
This was not a single-prompt build. The work included finding relevant public datasets, reading their definitions and deciding which comparisons would be useful to a business owner or adviser.
Our research drew on Companies House, ONS and NOMIS, alongside StatsWales and other official publications. We used Python for analysis and charts in the companion research. The task was to understand what each source could tell us, where the sources differed and what we could responsibly bring into the same view.
The Cardiff example shows why that matters. A number can be correctly calculated and still invite the wrong interpretation. Before deciding how to display it, we had to investigate what it represented.
Then came the work of distilling that research into an interface. Which questions should lead? What should appear on the map? What belongs in the Data view? Which comparisons help someone in the You view, and which explanations need to remain beside the answer?
The build record shows those decisions being developed through repeated revisions over 3–4 September. Metric-led controls became questions, the readout moved into a single panel beside the model, and the layout changed to support the different views.
Open-source libraries gave us components to build on. Faster development let us try the interface, inspect what was confusing and refine it. The skill lay in bringing the research, information design and implementation together so that someone else could use the result.
That is the opportunity these tools create: more room to explore and build, with the quality of the result still depending on the work behind it.
More people can build something useful for Wales
Open Senedd began as an independent experiment by Owen Derbyshire, Chief Executive of Keep Wales Tidy. In his introduction to the prototype, Owen described wanting to make the Senedd more transparent and give people working on policy better tools to understand its work. He explored how digital tools and AI could make parliamentary information easier to navigate, search and understand.45
The project now brings public records into a searchable interface, with topic briefs and links back to official sources. It is an independent side project, rather than a Keep Wales Tidy service.67
That is an encouraging example of what becomes possible when someone with a question can experiment with the information behind it. Sector Pulse Wales approaches business information; Open Senedd approaches the parliamentary record. Both give people another way to explore information that was already public.
This is where AI-assisted development can help democratise the use of data. More people can try building a tool around the questions that matter to them, rather than relying entirely on how someone else has chosen to present the information.
For Wales, that could mean a community group exploring a local issue, a charity making evidence easier to follow, or a business owner understanding their sector. These are possibilities to work towards: people using public information to ask better questions, contribute their knowledge and build things that help improve Wales.
Making a tool easier to build does not remove the need to check its sources and explain its limits. It gives more people the opportunity to take part.
Open Senedd also documents a read-only connection through the Model Context Protocol, or MCP, which lets compatible AI assistants query its public information.8 Exploring business and parliamentary information within one workflow could be a useful follow-up experiment. We have not tested that connection; any comparison would still need to account for differences in geography, dates and definitions.
What we can say so far
Sector Pulse Wales gives us a concrete example of AI-assisted development producing a tool that people can inspect and explore. We have not measured advisers’ time savings or established improved business decisions, and the dated build record is not a controlled comparison with conventional development.
What we would repeat is the approach: start with a question someone needs help answering, make the underlying information inspectable and keep important explanations beside the result.
Explore Sector Pulse Wales (opens in a new tab).
If you had access to open datasets and a tool that could build anything on top of them, what would you build?
Last checked: 29 October 2026.